Log collection
This document explains how to enable centralized log collection for the MoAI Inference Framework using Loki (log aggregation) and Vector (log collection agent).
Overview
flowchart TB
    pods["`**Inference Service Pods**`"]
    vector["`**Vector**`"]
    grafana["`**Grafana**`"]

    subgraph log_storage["Log Storage"]
        loki["`**Loki**`"]
        minio[("**MinIO**")]
    end

    pods -->|"container logs"| vector
    vector -->|"transforms + labels"| loki
    loki -->|"LogQL"| grafana
Architecture details
Loki
Vector
MinIO
Component naming
Service names are derived from the Helm release name. With the default release name mif:
Vector connects to Loki using the release-prefixed service name since all components are co-located in the same namespace.
Prerequisites
- The
moai-inference-frameworkHelm chart installed (or being installed).
Info
MinIO, Loki, and Vector are all enabled by default in the moai-inference-framework chart. No additional configuration is required to get started.
Installation
Log collection is installed as part of the moai-inference-framework Helm chart. See Prerequisites for the required values and install command.
Verifying the installation
Check that all Loki components are running.
kubectl get pods -n mif -l app.kubernetes.io/name=lokiNAME READY STATUS RESTARTS AGE
loki-backend-0 1/1 Running 0 2m
loki-gateway-xxxxxxxxx-xxxxx 1/1 Running 0 2m
loki-read-xxxxxxxxx-xxxxx 1/1 Running 0 2m
loki-write-0 1/1 Running 0 2mCheck that Vector is running on all nodes.
kubectl get pods -n mif -l app.kubernetes.io/name=vectorNAME READY STATUS RESTARTS AGE
vector-xxxxx 1/1 Running 0 2m
vector-yyyyy 1/1 Running 0 2mCheck Vector logs to confirm it is shipping to Loki without errors.
kubectl logs -n mif -l app.kubernetes.io/name=vector --tail=50Enabling log collection for a pod
Vector collects logs only from pods that explicitly opt in. Two pod labels control this behavior.
Opt-in label
Add the mif.moreh.io/log.collect=true label to a pod to include its logs in Vector's collection. Pods without this label are ignored entirely.
metadata:
  labels:
    mif.moreh.io/log.collect: "true"
Log format label
Add the mif.moreh.io/log.format=json label to enable structured JSON log parsing for a pod. When set, Vector parses each log line as JSON and promotes the following fields:
Without this label, the log line is forwarded as-is without any JSON parsing.
metadata:
  labels:
    mif.moreh.io/log.collect: "true"
    mif.moreh.io/log.format: "json"
Info
The level Loki label is only populated for pods with mif.moreh.io/log.format=json. For plain-text pods, level remains empty.
Searching logs in Grafana
Accessing Grafana
If you have not yet accessed Grafana, follow the Accessing Grafana guide to retrieve admin credentials, set up port forwarding, and log in.
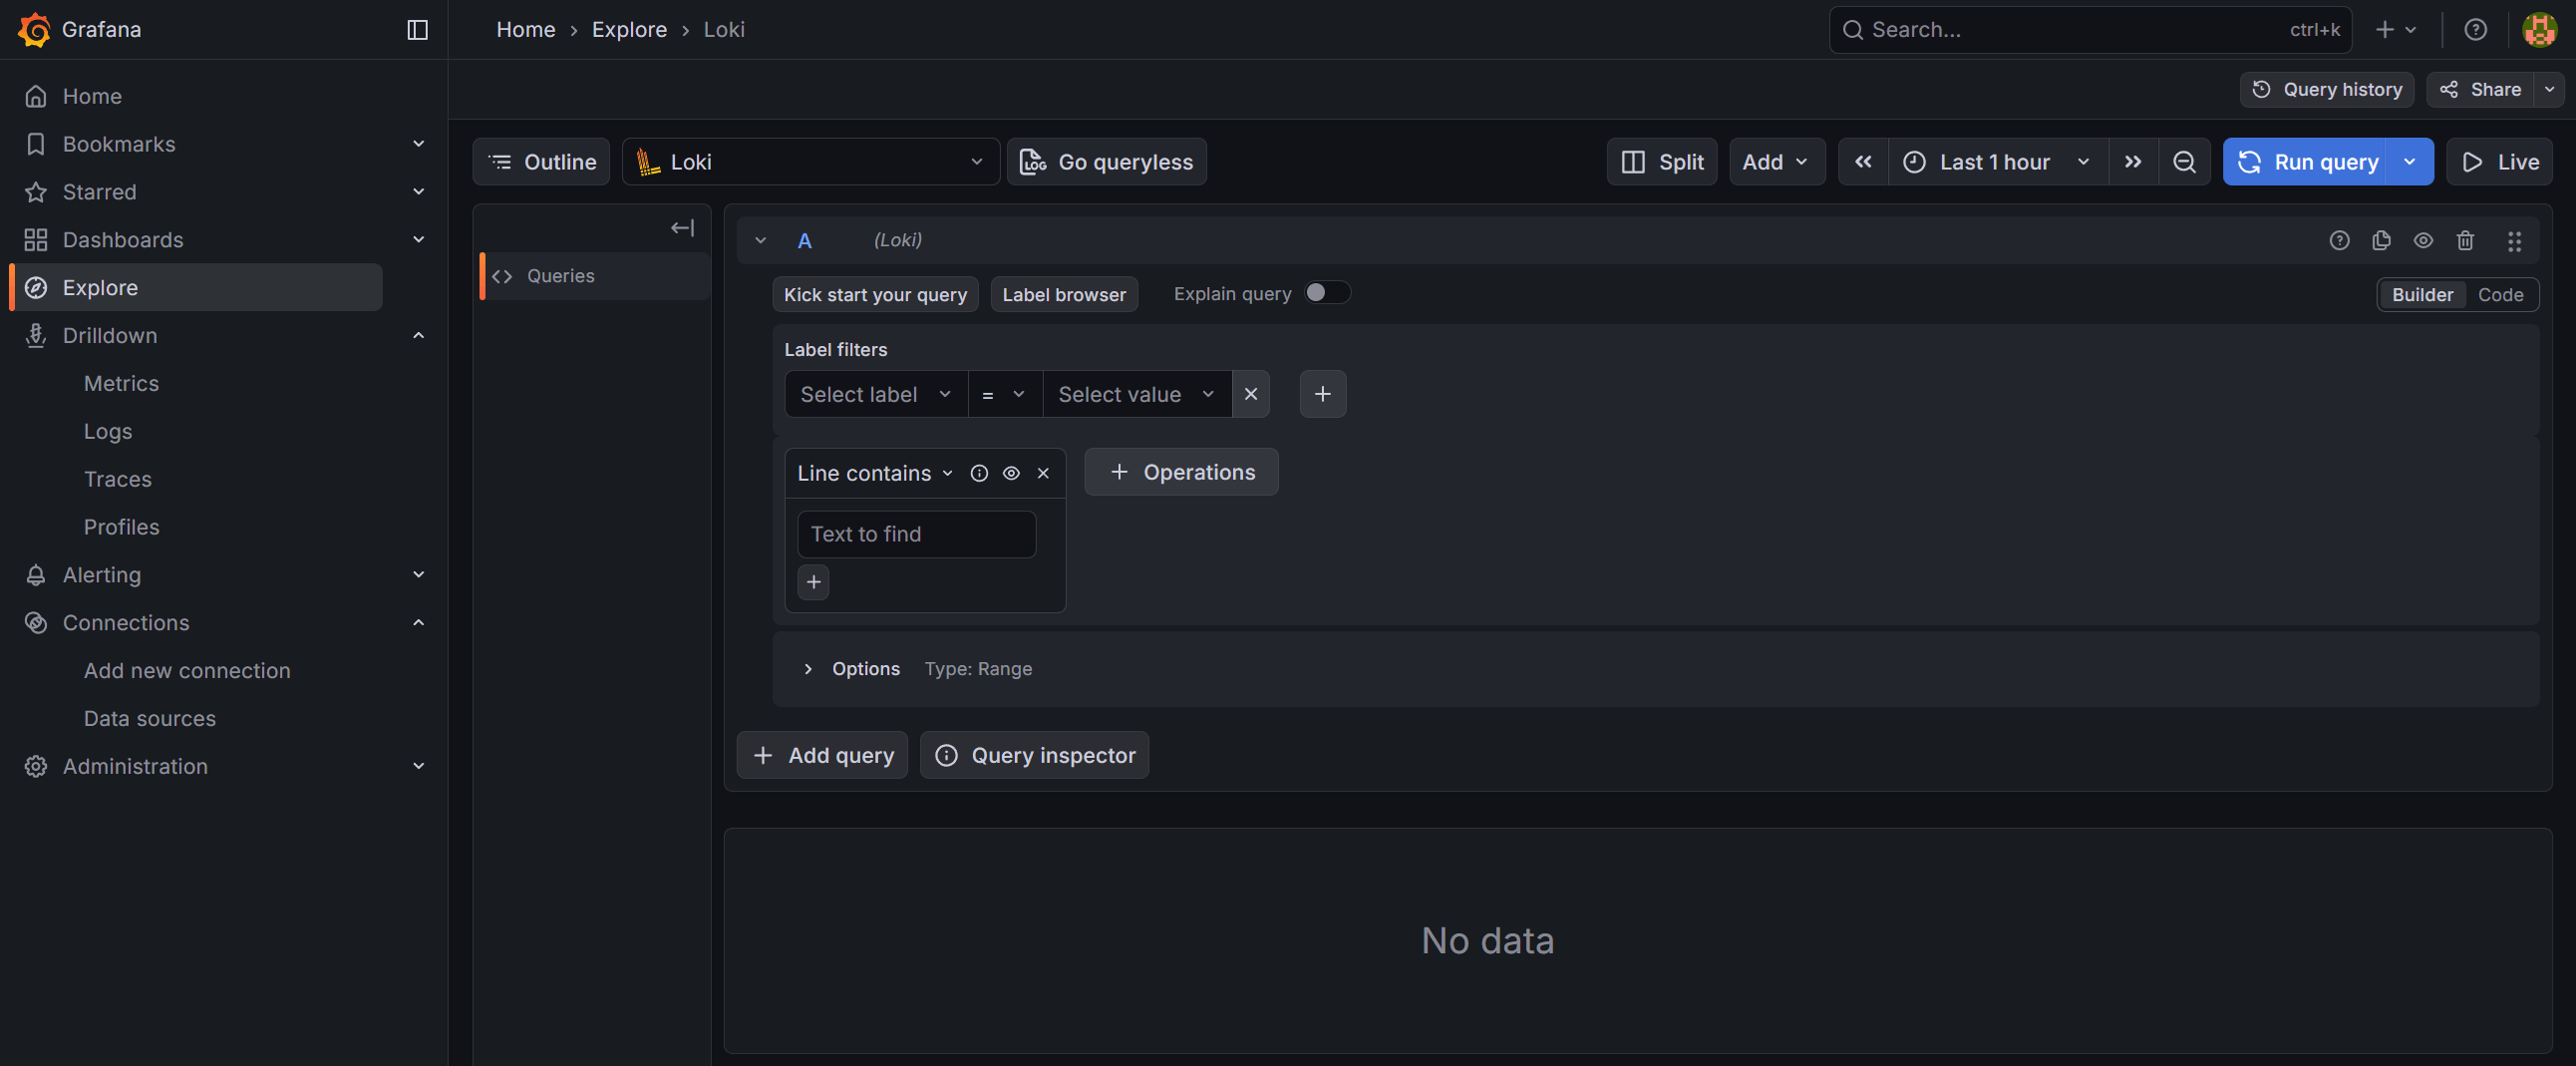
Opening the Explore view
After logging in to Grafana, click on the Explore icon (compass) in the left sidebar. You will see the Explore view with a query editor:
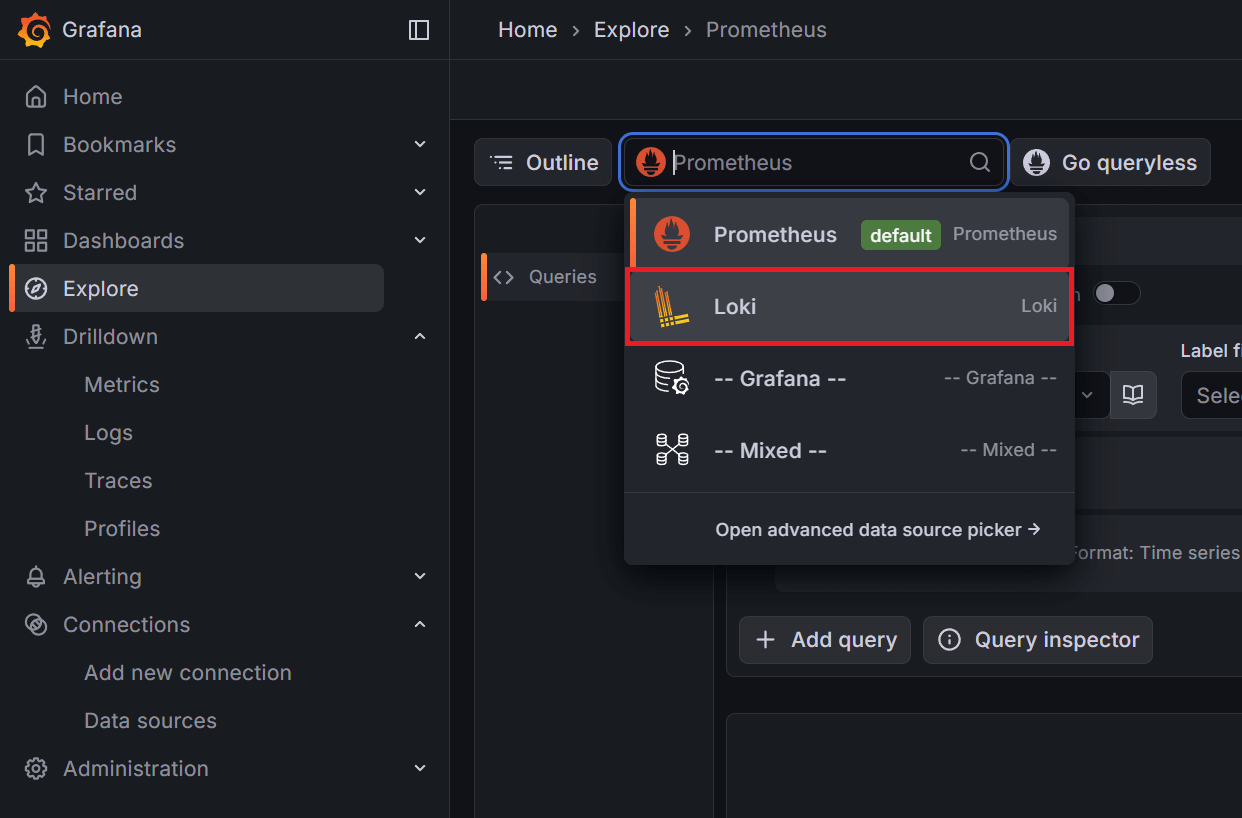
Selecting the Loki datasource
If the datasource is not already set to Loki, click the datasource dropdown at the top of the page and select Loki:
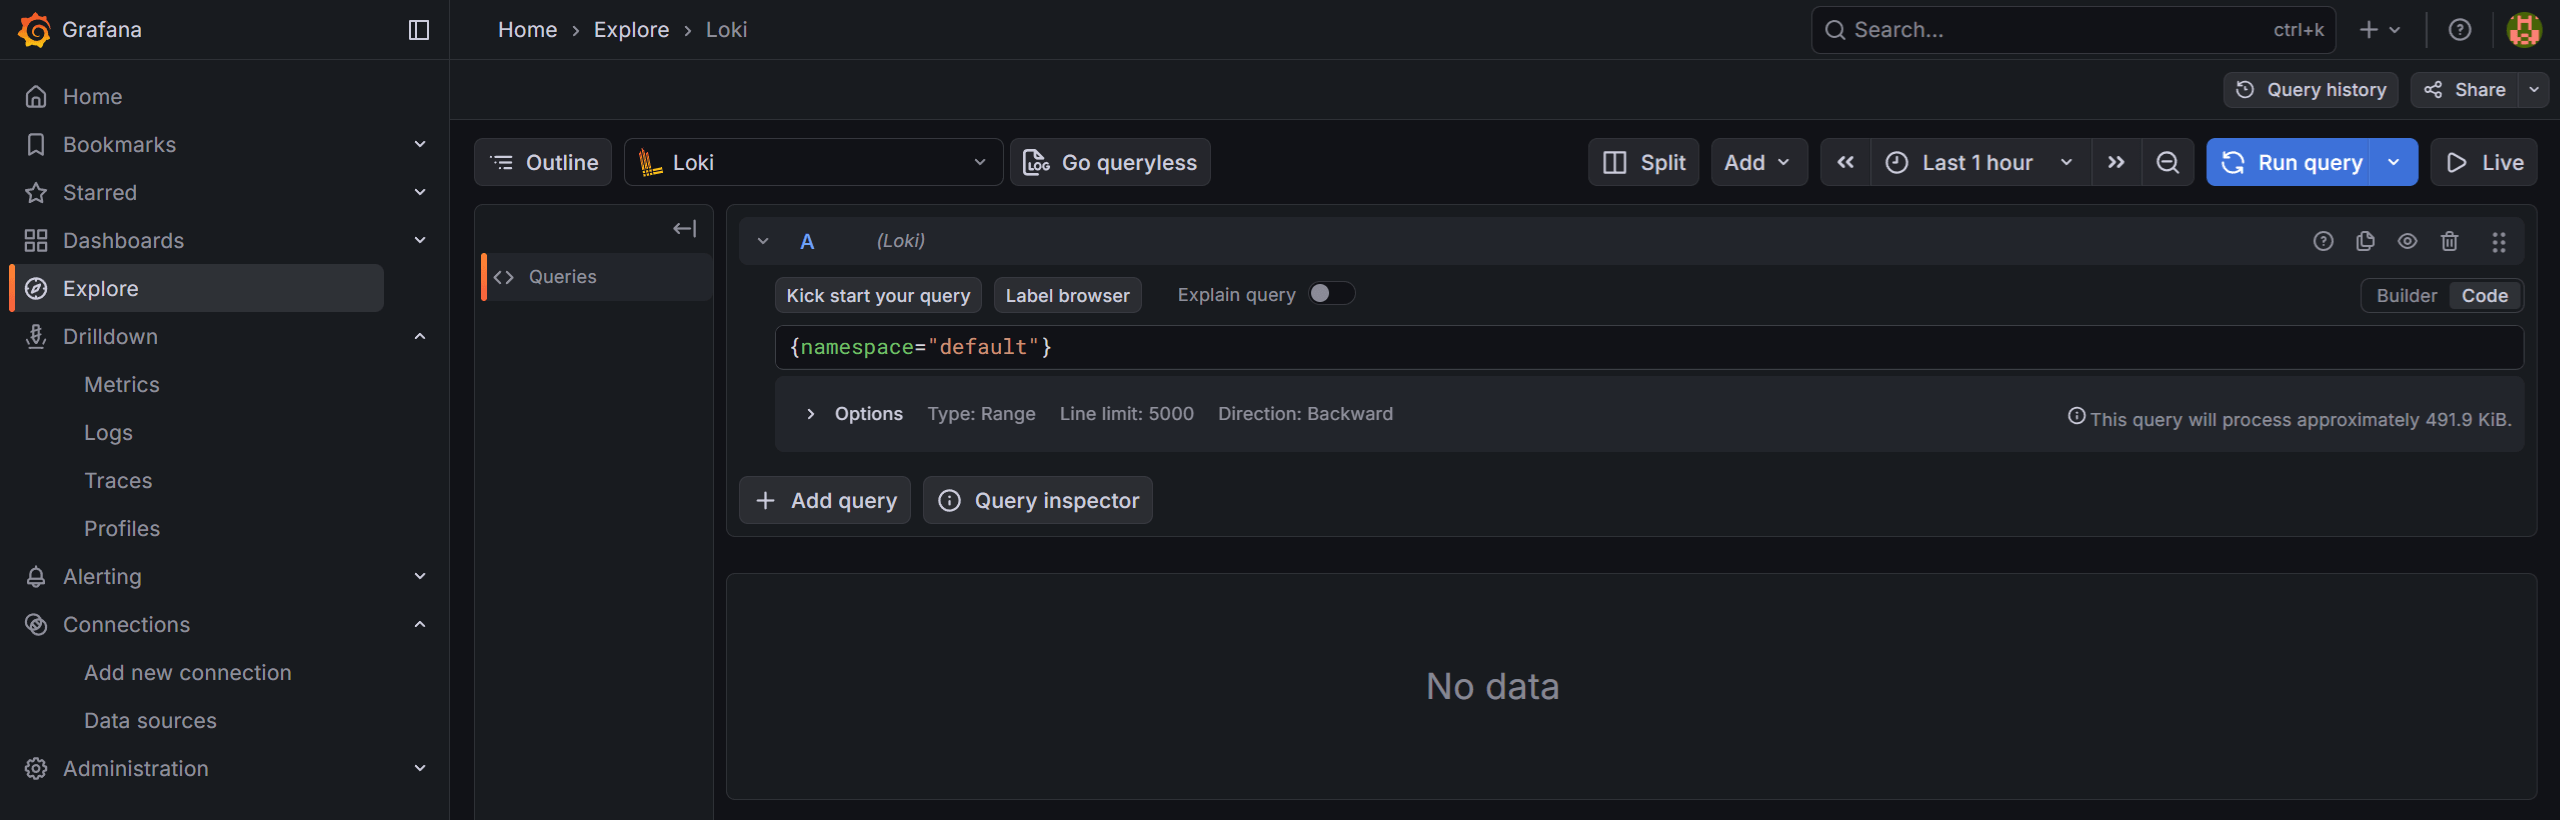
Switching to Code mode
The query editor defaults to Builder mode, which provides a visual query builder. To write LogQL queries directly, click the Code button to switch to Code mode:
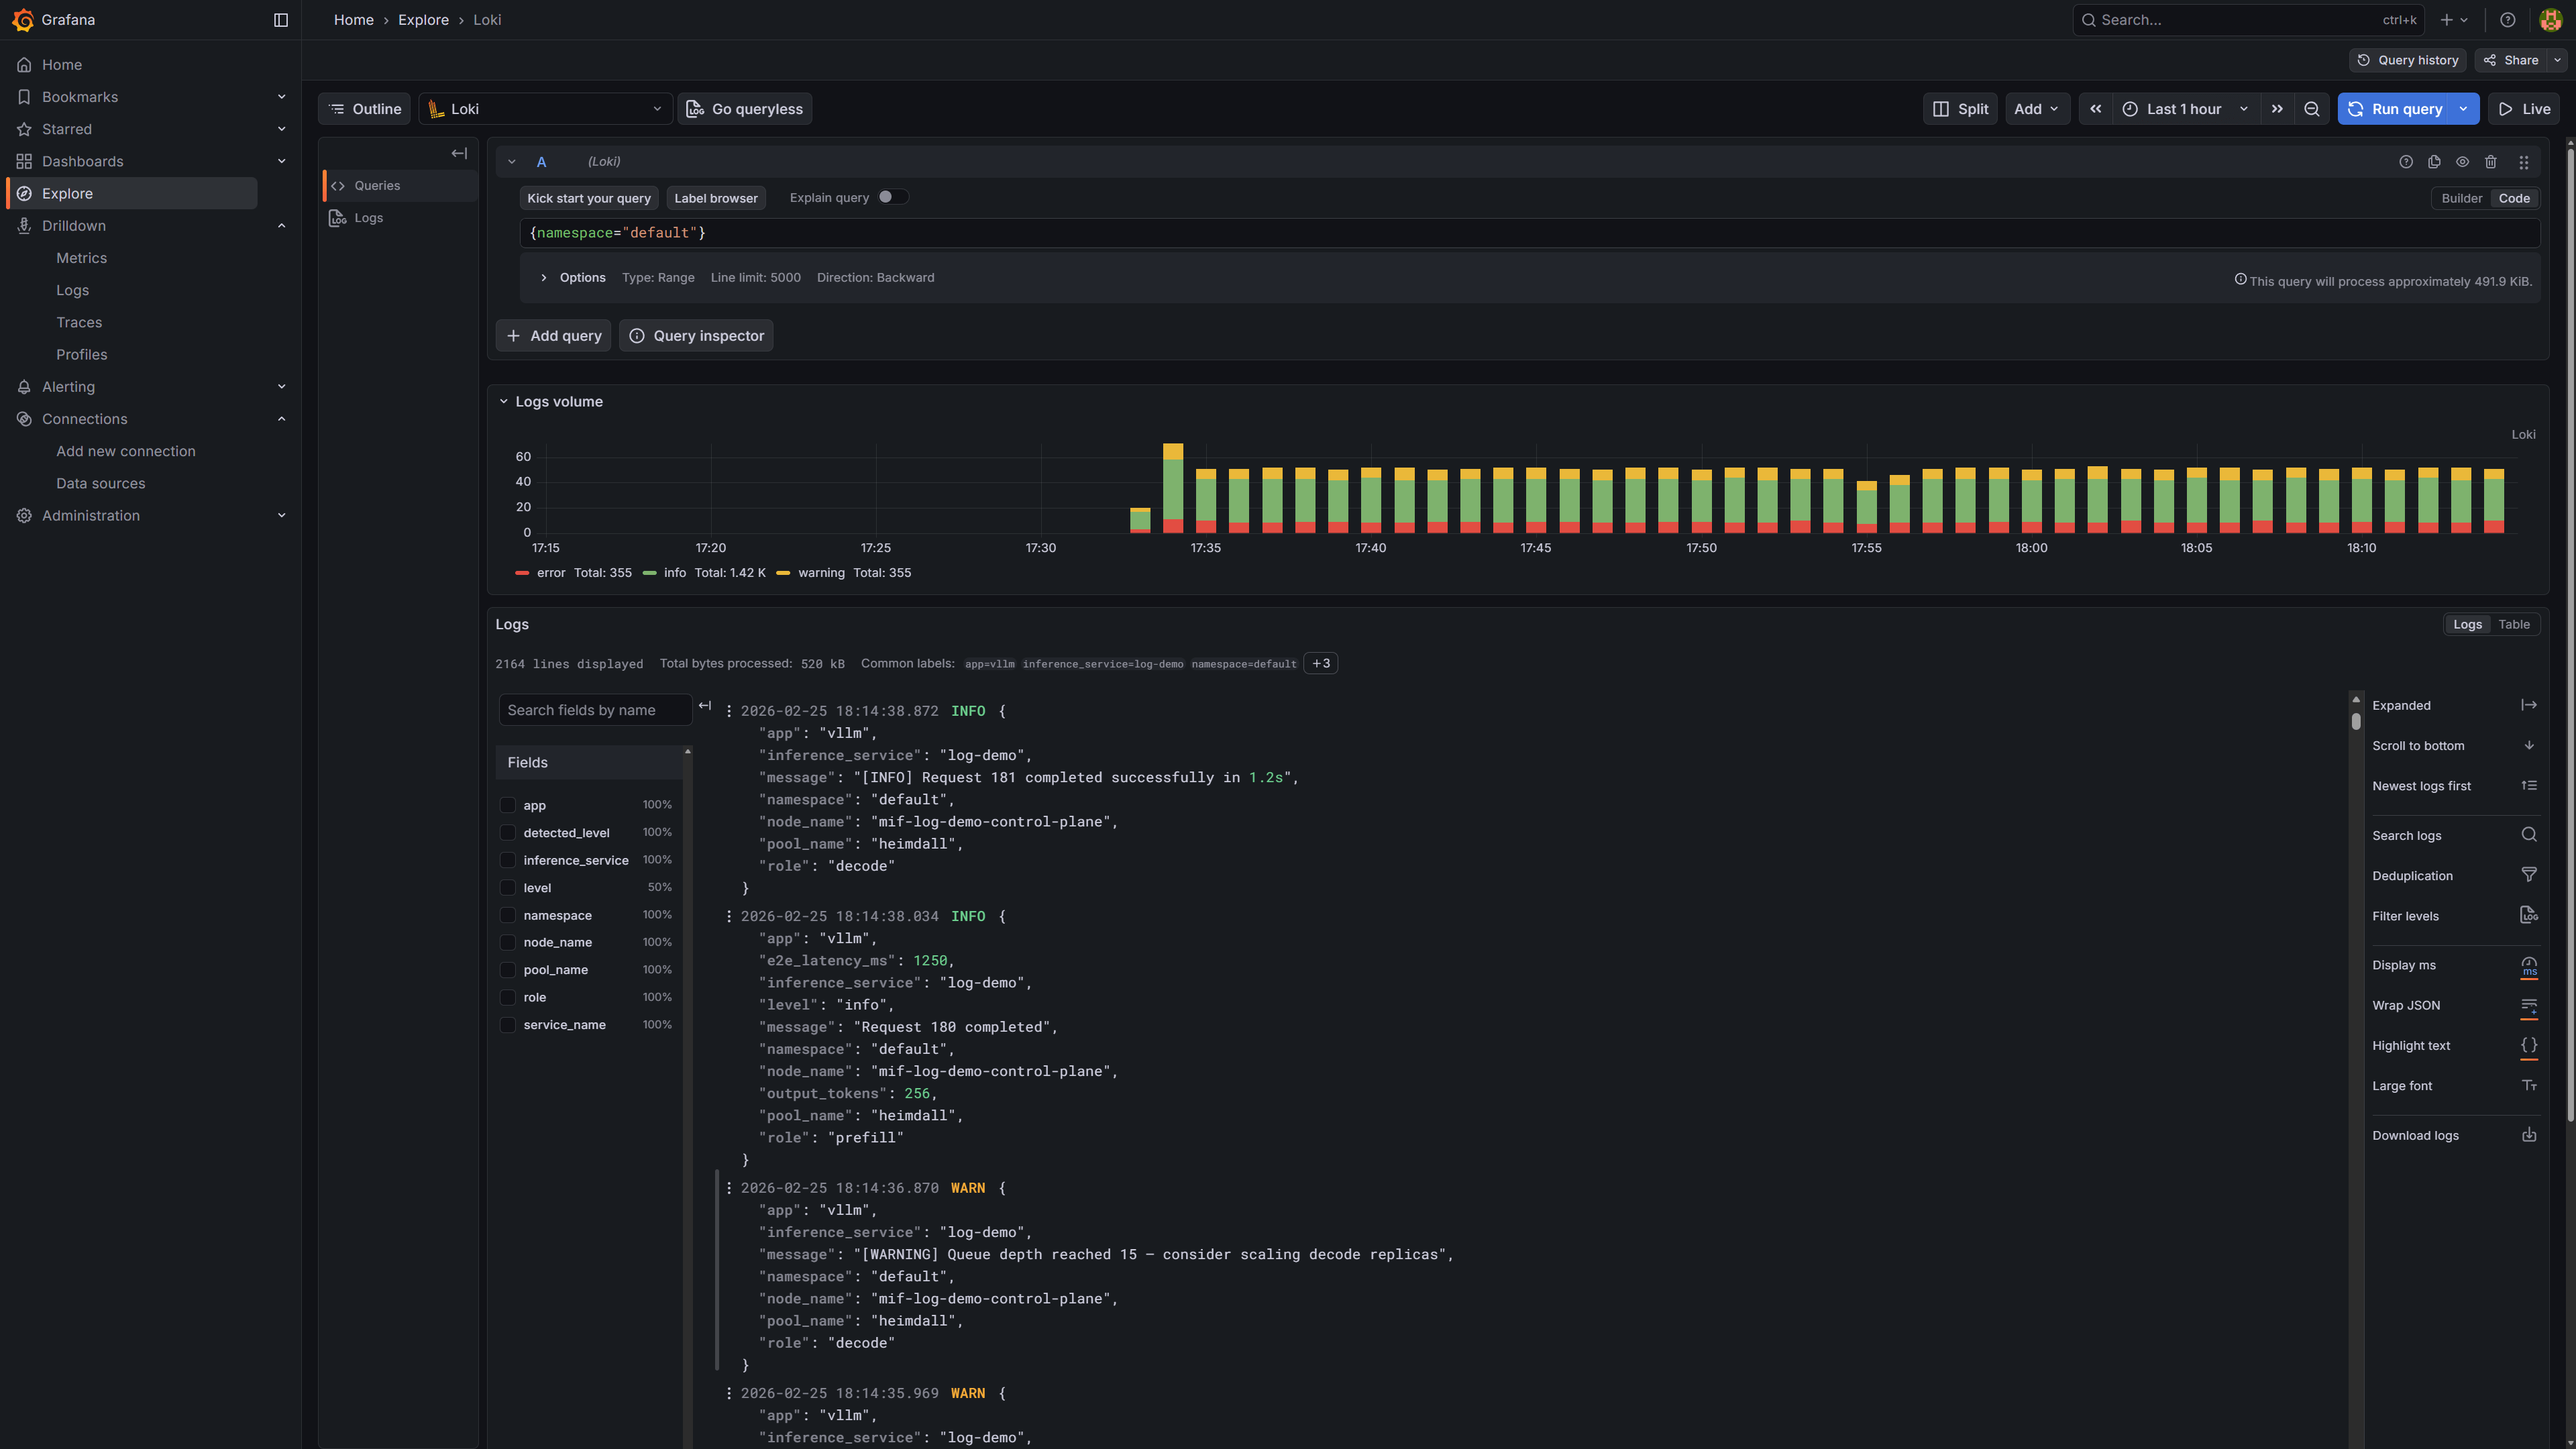
Running a log query
Enter a LogQL query in the query editor and click Run query (or press Shift+Enter). For example, {namespace="default"} returns all logs from the default namespace. The screenshot below shows the results, which include both plain-text and JSON-formatted logs collected from different pods:
Labels available for log search
Vector enriches every log entry with the following labels, which can be used as LogQL selectors:
Query examples
Filter by a single label:
{namespace="default"}
{inference_service="llama-3-2-1b"}
{pool_name="heimdall"}
{role="decode"}
Combine multiple labels and search for a keyword in the log line:
{namespace="default", inference_service="llama-3-2-1b", role="prefill"} |= "error"Filter by log level (available only for JSON-formatted pods):
{namespace="default", level="error"}Info
The level label is only available for pods with the mif.moreh.io/log.format=json label. To filter plain-text logs by level, use a pipeline filter instead:
{namespace="default"} |= "ERROR"Using an external MinIO
If MinIO is already deployed outside this chart, set minio.enabled: false and configure lokiBucket with the host and credentials of a MinIO user that has read/write access to the loki bucket.
Same namespace — if the existing MinIO service name matches <release>-minio, only credentials are required:
minio:
  enabled: false
lokiBucket:
  accessKey: <accessKey>
  secretKey: <secretKey>
Different namespace — set lokiBucket.host to the FQDN so that Loki can resolve it cross-namespace:
minio:
  enabled: false
lokiBucket:
  host: <minio.minio.svc.cluster.local>
  accessKey: <accessKey>
  secretKey: <secretKey>
Disabling log collection
minio:
  enabled: false
loki:
  enabled: false
vector:
  enabled: false